
Home
IBI
Our benchmarking
Our products
Wtp
Media
Get in touch

Home/Our benchmarking

Our benchmarking

Thorough benchmarking, from definition to chart

A comparison that looks beyond the level of costs and takes into account the main factors that explain that cost level.

Principles

Seven principles

The IBI benchmark is built around a fixed set of principles. They determine what is measured, how it is calculated and what the outcomes must satisfy.

  • Benchmarking that follows the needs and wishes of pension fund boards
  • Based on Dutch legislation and regulation
  • Seeing the costs of pension funds in the right context, in relation to risk and returns
  • Audited input and reliable calculations based on predefined definitions
  • Input largely based on uniform, already available and audited reports
  • A product that fully meets the Recommendations on Implementation Costs issued by the Pensioenfederatie
  • The benchmark covers all costs
Sounding board group

A benchmark by and for the sector

Members of the sounding board group translate the wishes of the sector and help shape the content of the report, primarily for the benefit of the board. Through this link, IBI Benchmarking becomes a benchmark by and for the sector.

At the founding of IBI, the sounding board group consisted of PFZW, Pensioenfonds TNO, PNO Media, PME, Pensioenfonds Randstad and Pensioenfonds Vervoer.

Sounding board group at founding

PFZW Pensioenfonds TNO PNO Media PME Pensioenfonds Randstad Pensioenfonds Vervoer

The institute consults pension funds periodically about the content of the reports, so that these are adapted to developments in the pension sector.

The report was developed together with this group, on the principle that all bold-typed recommendations from the Recommendations on Implementation Costs (revised version 2016) are met.

View the 22 bold-typed recommendations
Thorough benchmarking

Not just the level of costs

At IBI we speak of thorough benchmarking. This is a comparison that looks not only at the level of costs, but also takes into account the main factors that explain that cost level. In this way a pension fund board can assess whether the costs are appropriate given the fund's policy, risks, scale and service delivery.

CFA Society Netherlands also described IBI's benchmarking as a way of arriving at a “nuanced comparison of implementation costs”, taking account of the specific characteristics of the pension fund. IBI was explicitly named in this context.

“A nuanced comparison of implementation costs, taking account of the specific characteristics of the pension fund.”

CFA Society Netherlands on IBI's benchmarking · translated from Dutch
Legislation as foundation

Statutory key figures and self-regulation

Legislation

The legislation on the key figures to be reported for implementation costs has remained unchanged under the Wtp. It reads as follows:

  • Pension funds must report the total costs of asset management in euros and as a percentage of average assets under management. The same applies to transaction costs.
  • As regards pension administration costs, the costs must be reported in euros per member and as a total in euros. The number of members is the sum of active members and pensioners.

For the explanation of implementation costs, the AFM refers to the Recommendations on Implementation Costs established through self-regulation. This explanation enables members to assess costs in context. In other words: what do I get back for these costs, taking account of policy decisions? Consider, for example, returns and service.

Recommendations on Implementation Costs

It is important that benchmarking is carried out on the basis of uniformly calculated statutory key figures as set out in the Recommendations on Implementation Costs: the applicable framework for pension funds for reporting implementation costs, established through self-regulation by the committee on reporting and implementation costs of the Pensioenfederatie, with Anne Laning and Eric Veldpaus as important co-authors.

The draft version was coordinated with, among others, pension funds, asset managers, pension administration organisations, accountants and the supervisory authorities DNB and AFM. The aim was to establish that the requested data can be delivered and verified by the auditing accountants. It is important that supervisory authorities also endorse this.

“I do not see the Recommendations on Implementation Costs as a purely technical compliance issue, but also as a governance and accountability issue, in which compliance certainly plays an important role. Precisely in the case of self-regulation and open norms, it is about keeping the board focused on the underlying rationale of transparency, and not merely on formal compliance. In addition, disputes about costs can give rise to legal risks.”

“In view of the Wtp, this issue is becoming more urgent. The introduction of cohorts and possible cost differences within a single fund increases the risk of questions, complaints and disputes. Timely, clear and explainable communication is essential in this, but also complex.”

Bianca van der Goes Certified pension lawyer, Sprenkels · translated from Dutch

Recommendations on Implementation Costs

The Pensioenfederatie's framework for reporting implementation costs, revised version 2016. The document is available in Dutch.

Download the Recommendations View the 22 bold-typed recommendations
Appendix

The 22 bold-typed recommendations

All bold-typed recommendations fall under the ‘comply or explain’ principle, unless legislation and regulation prescribe a recommendation as mandatory — such as the three key figures that must be reported. If a pension fund chooses to deviate from a recommendation, it includes an explanation of the reason for the deviation in its annual report.

View all 22 bold-typed recommendations
  1. The key figure for asset management costs is presented as a percentage with two decimal places.
  2. Also consider these costs in relation to:
    • the chosen investment policy and the associated benchmark costs — benchmarking indicates what the costs for the pension fund would have been if the investment portfolio, with the chosen allocation across the various asset categories, had been managed at the average costs of the universe. This information allows the board to assess the fund's cost level;
    • the return over a longer period, also in relation to the associated benchmark return.
  3. The key figure for transaction costs is presented as a percentage with two decimal places.
  4. Information on the level of implementation costs is accompanied by information on the relevant policy choices.
  5. Members must have access to high-level information about implementation costs.
  6. The nature of the service delivery leads to cost differences. The pension fund explains this in its board report.
  7. When making costs transparent, costs are not netted against income. One of the fundamental principles is that costs are reported separately.
  8. If a pension fund invests through investment funds, the asset management costs and transaction costs of those investment funds are included in the total costs.
  9. Income and costs are allocated to the period to which they relate, whereby costs are appropriately recognised in the same period as the related income.
  10. One-off costs are included in the calculation of costs.
  11. One-off costs are explained in the board report.
  12. Pension funds report costs transparently in accordance with these Recommendations, including an explanation of the accounting principles applied. Where insight into costs is not yet complete, or not yet possible because of existing contractual provisions for example, an estimate of the costs together with an explanation is included in the report.
  13. Cost-increasing taxes are included as costs in the category on which those taxes fall; thus VAT on asset management costs as asset management costs, and so on.
  14. Taxes on returns are not counted as costs, because these are not cost-increasing levies.
  15. All costs are presented in euros.
  16. All costs are included when determining pension administration costs. If a material part of the pension administration costs is permanently not borne by the pension fund because it is borne by the employer(s), these costs are nevertheless included in determining pension administration costs, in order to promote comparability with other pension funds. Where these costs are not included and are material for insight into the costs, they are explained separately in the annual report.
  17. Pension funds themselves allocate general costs to pension administration and asset management costs and substantiate this estimate. The substantiation of the estimate is explained in the annual report.
  18. Pension administration costs are divided by the number of active members and pensioners.
  19. The numbers of active members and pensioners that together form the total in the denominator are equal to the data reported to DNB in annual return J701. By aligning with DNB's definition, double counting is avoided as far as possible.
  20. Applying the look-through principle means that all asset management costs at all levels must be made transparent.
  21. In the case of a direct investment listed on an exchange, management costs are integrated into the market price. Because they are inextricably linked to the profit and loss account of the listed entity, these costs are not designated as asset management costs and are not included.
  22. Average assets under management (AuM) are calculated on the basis of month-end positions: average assets under management = (0.5 × Dec + Jan + Feb + … + 0.5 × Dec) / 12.
Input

As much as possible from existing, audited sources

To limit the workload for the participating pension fund, IBI makes as much use as possible of data that is already available. These are reports to DNB audited by accountants, and the annual report.

It is important that the report ties in with the data as reported in the annual report. To obtain the asset management data, a spreadsheet is used that immediately shows whether the data reconciles with the figures in the annual report. For pension administration it is likewise established whether the costs per member reconcile with the reported costs. In addition, the pension fund receives questions through a digital survey, some of which originate from existing reports to DNB.

To assess the service level and complexity of the pension fund, mainly multiple-choice questions are used. On the basis of the answers, the service level and the complexity of the pension scheme to be administered are determined. As we understand it, the service level agreement with the pension administration organisation is a good basis.

Clients receive a verification copy of the report, so that it can be checked whether any corrections need to be made before the report is finalised.

  1. Existing reports

    Reports to DNB audited by accountants, and the annual report, form the starting point.

  2. Reconciliation with the annual report

    A spreadsheet immediately shows whether the asset management data reconciles with the annual report.

  3. Digital survey

    Multiple-choice questions determine service level, complexity and degree of automation.

  4. Verification copy

    The pension fund checks the input before the final report is drawn up.

Radar charts and benchmarking

A profile at a glance

At IBI we use radar charts because they show the profile of a pension fund at a glance, instead of separate figures only. A radar chart can display not only the costs, but also the factors that help explain them. Because we work with normalised scores (indices), the fund can be properly compared with a selected peer group and with the universe. This makes benchmarking more of a diagnostic instrument than a league table.
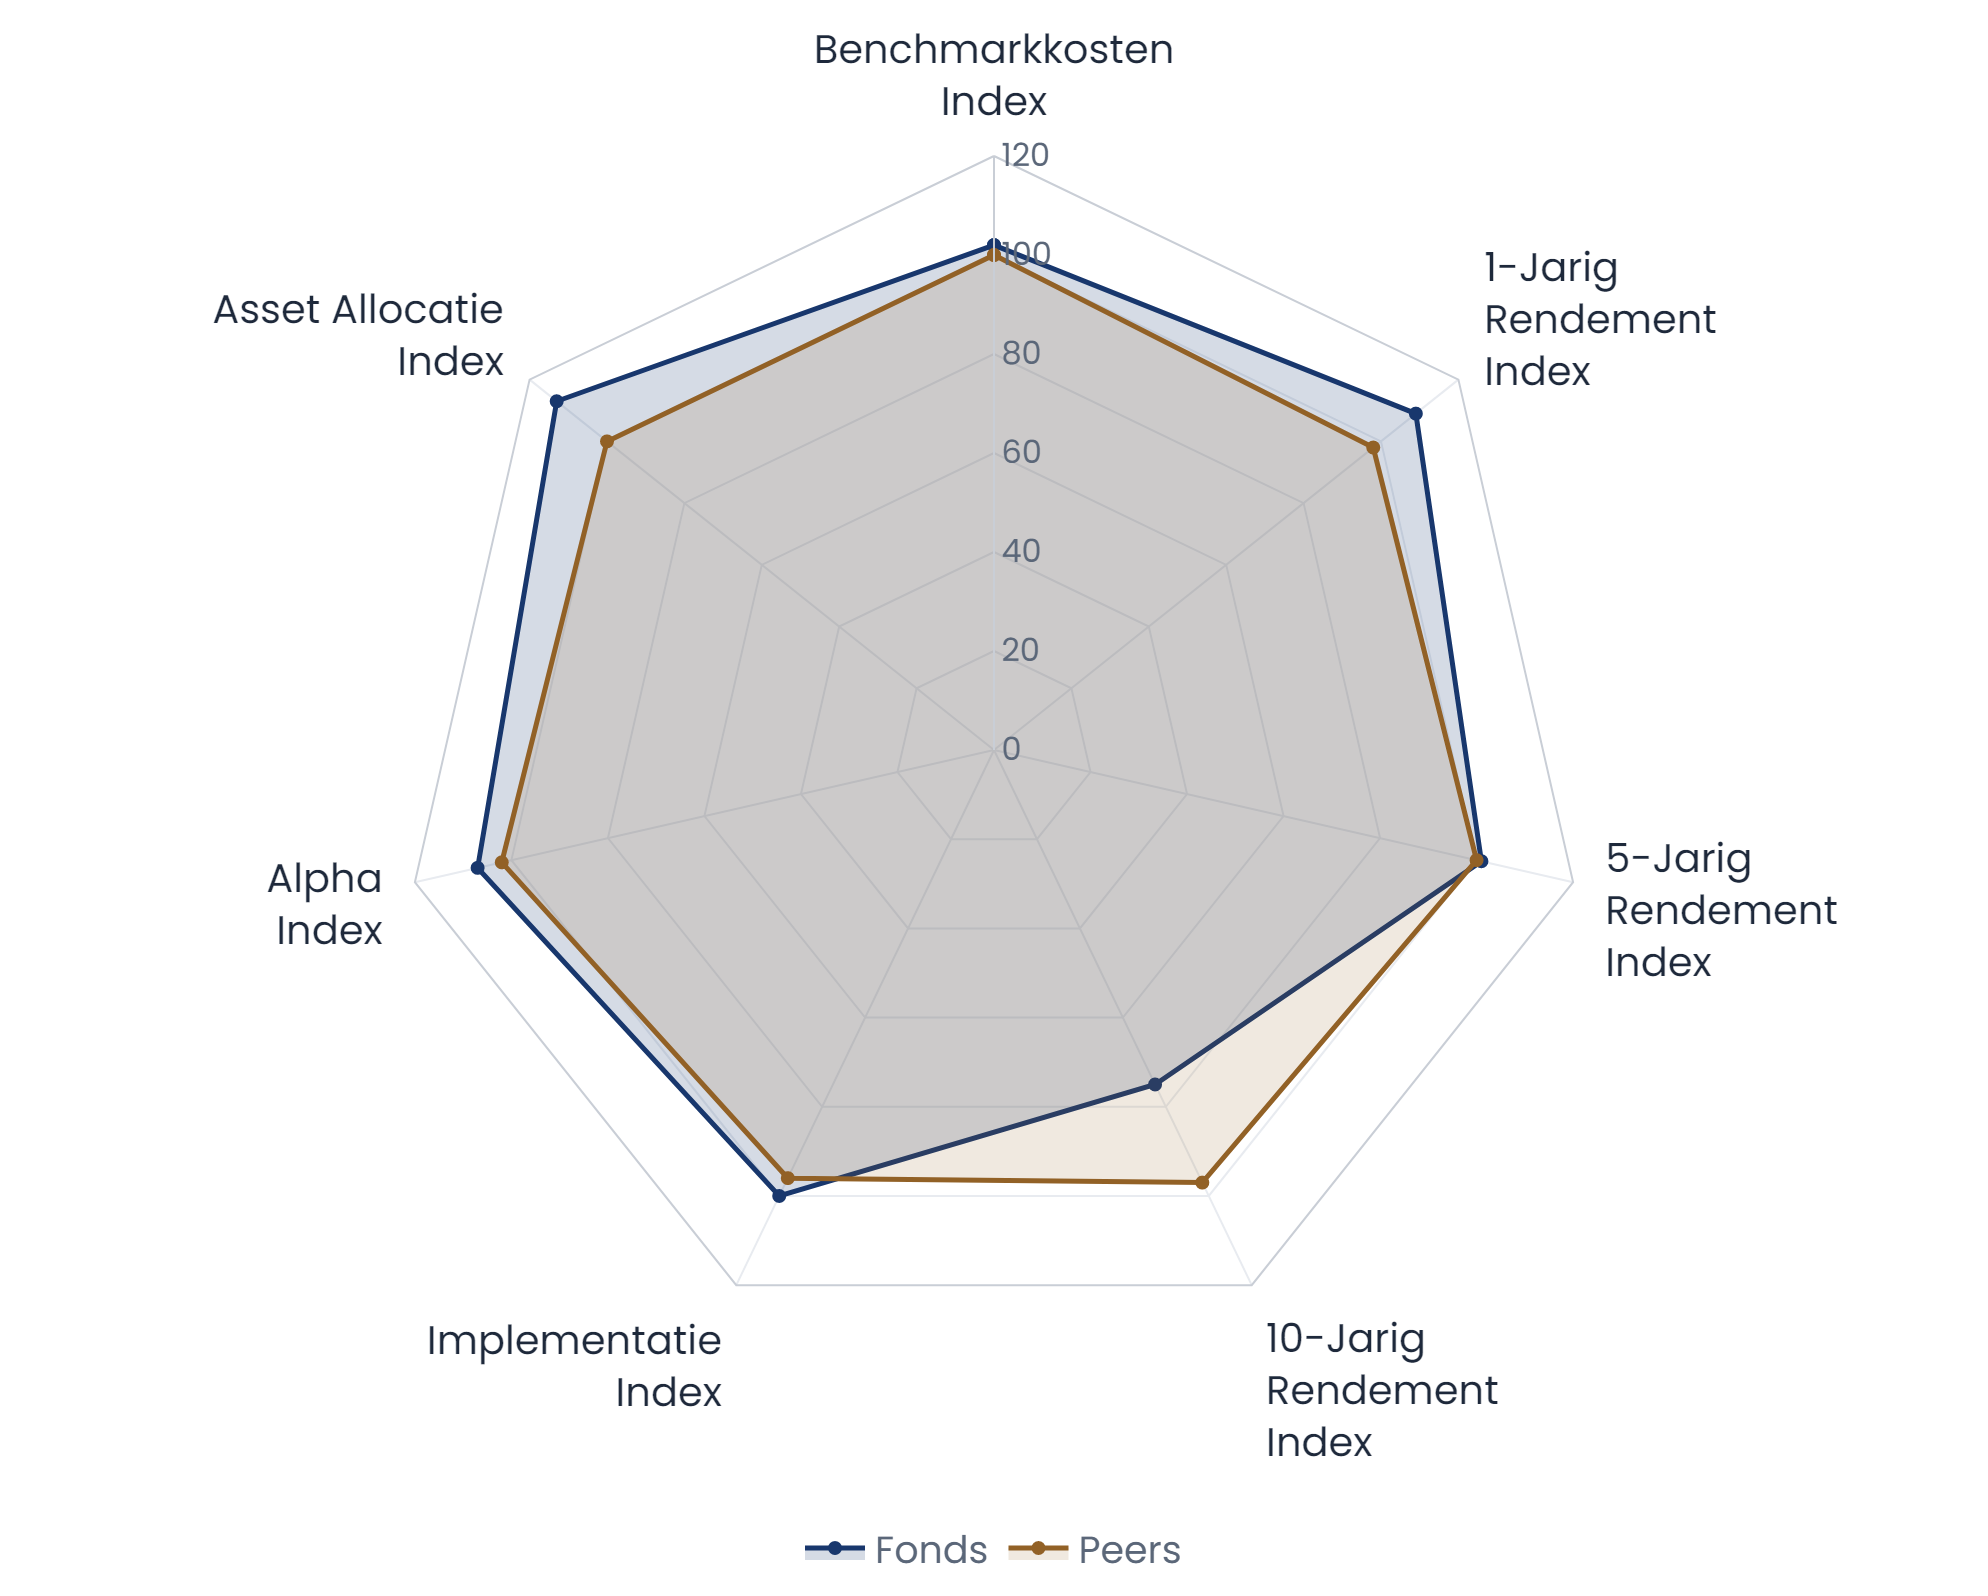
Radar chart asset management

Asset management

Policy choices of the pension fund

  • Spread of the assets (Asset Allocation Index)
  • Degree of active management (Alpha Index)
  • Investing through investment funds (Implementation Index)

Results

  • Benchmark costs* (Cost Benchmark Index)
  • 1-year return (1-year Return Index)
  • 5-year return (5-year Return Index)
  • 10-year return (10-year Return Index)

* Benchmark costs are the costs corrected for the investment mix using peer group data. This is not the same as the average costs.

For asset management, the sustainability of the investment portfolio is calculated additionally. This is not included in the radar chart.
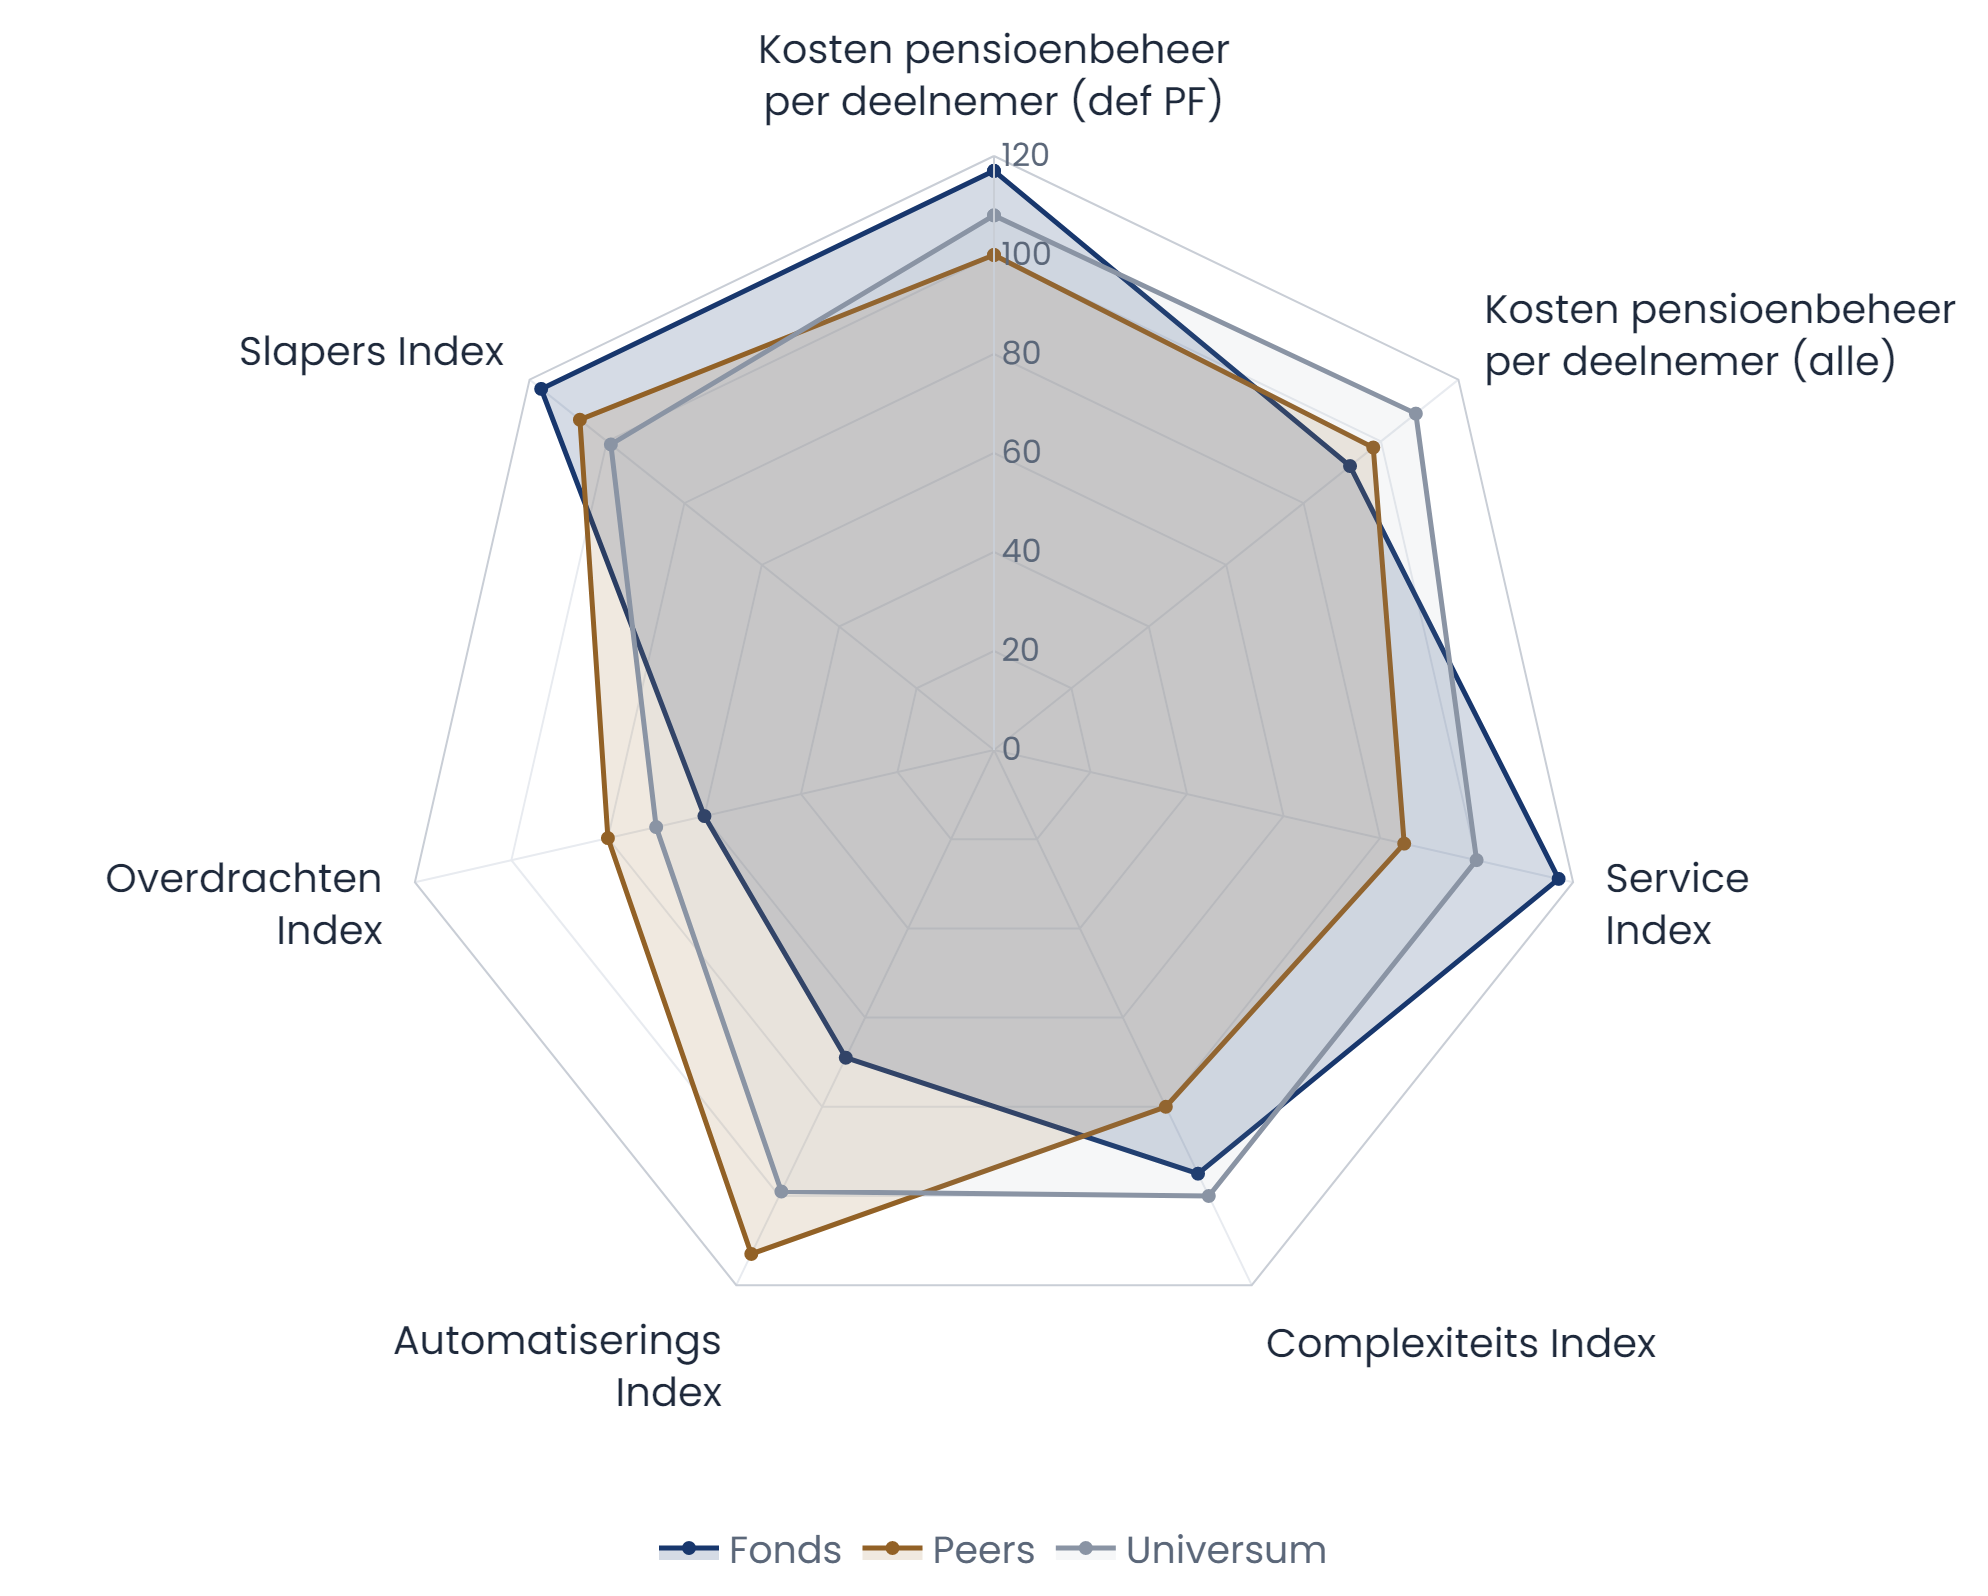
Radar chart pension administration

Pension administration

Policy choices of the pension fund

  • Level of service to the member, including communication strategy (Service Index)
  • Degree of complexity of the pension fund (Complexity Index)
  • Degree of process automation (Automation Index)

Characteristics

  • Number of value transfers (Value Transfer Index)
  • Number of deferred members (Deferred Members Index)

Results

  • Pension administration costs per member according to the Pensioenfederatie definition*
  • Pension administration costs per member (all)**

* According to the Pensioenfederatie definition: the sum of active members and pensioners at year-end.
** The average number of members during the reporting year (deferred members, active members and pensioners).

For pension administration, the percentage of governance costs allocated to asset management is also calculated. This is not included in the radar chart.

Curious what your profile looks like?

Curious what your asset management profile and your pension administration profile look like? We are happy to explain.