
Board summary
The key overviews and analyses in a single document for the board.
IBI provides pension funds with independent and thorough benchmarking of implementation costs. We place costs in the context of scale, complexity, investment policy, risk, return and service levels, among other factors.
The lowest costs are not the goal; appropriate costs are. The relevant question is: what does the pension fund — and ultimately the member — get in return for those costs?
IBI translates differences in costs and performance into the factors that cause those differences. Not only showing where a fund stands, but above all explaining why it stands there.
Uniformly calculated key figures, audited input and a comparison with peer group and universe.
Costs in relation to policy, risk, scale, complexity, return and service delivery.
Substantiation for decision-making, accountability and communication towards members.
The Pensions Act requires cost transparency. The Recommendations on Implementation Costs call for costs to be placed in perspective. The AFM stresses the importance of context and comparison.
And the Code Pensioenfondsen requires the board to monitor and evaluate the quality and costs of administration every year.
A cost figure, or a sector average on its own, is not enough for that.
Sound benchmarking shows how your fund compares with similar pension funds, what causes the differences, and what you get in return for the costs incurred in terms of quality, service, risk and return.
From a cost figure to a well-founded governance opinion.
Uniformly calculated statutory key figures, in line with the Recommendations on Implementation Costs.
Read more 02Geared to the needs of pension fund boards, with a sounding board group and audited input.
Read more 03A profile of the fund: the costs as well as the factors that explain the differences.
Read moreNot only where your fund stands, but why it stands there.
A radar chart shows an integrated profile at a glance: the costs, the factors that help explain them and — more importantly — what the pension fund gets in return in terms of return, service delivery and pension scheme. Because we work with normalised scores, the fund can be consistently compared with a selected peer group and with the universe.
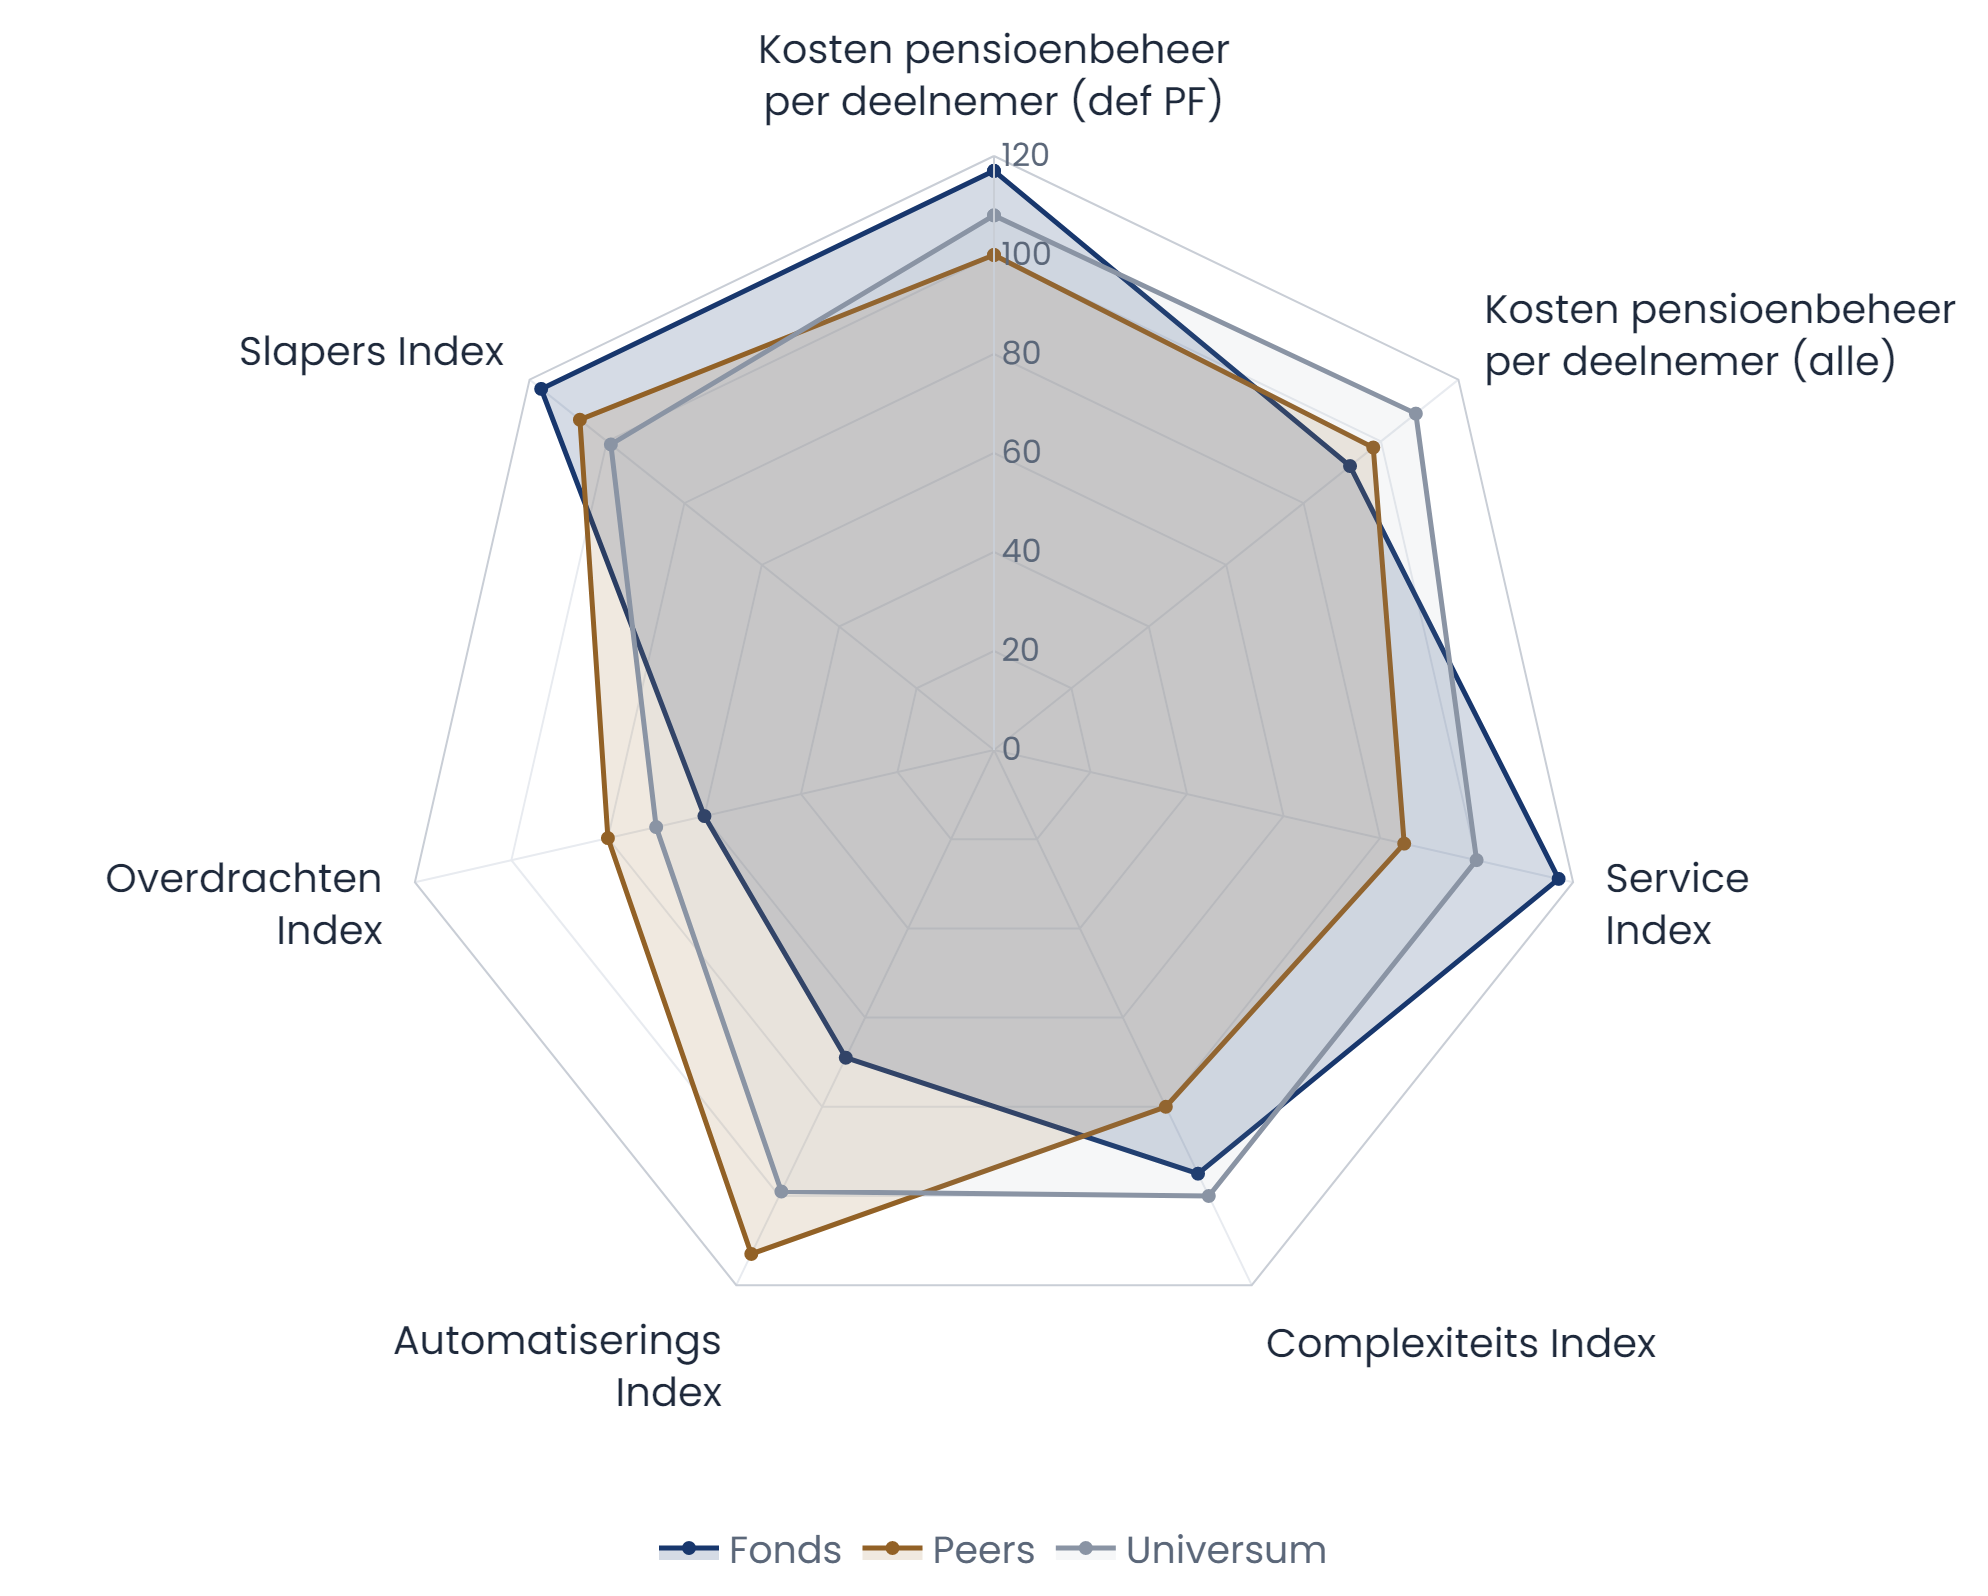
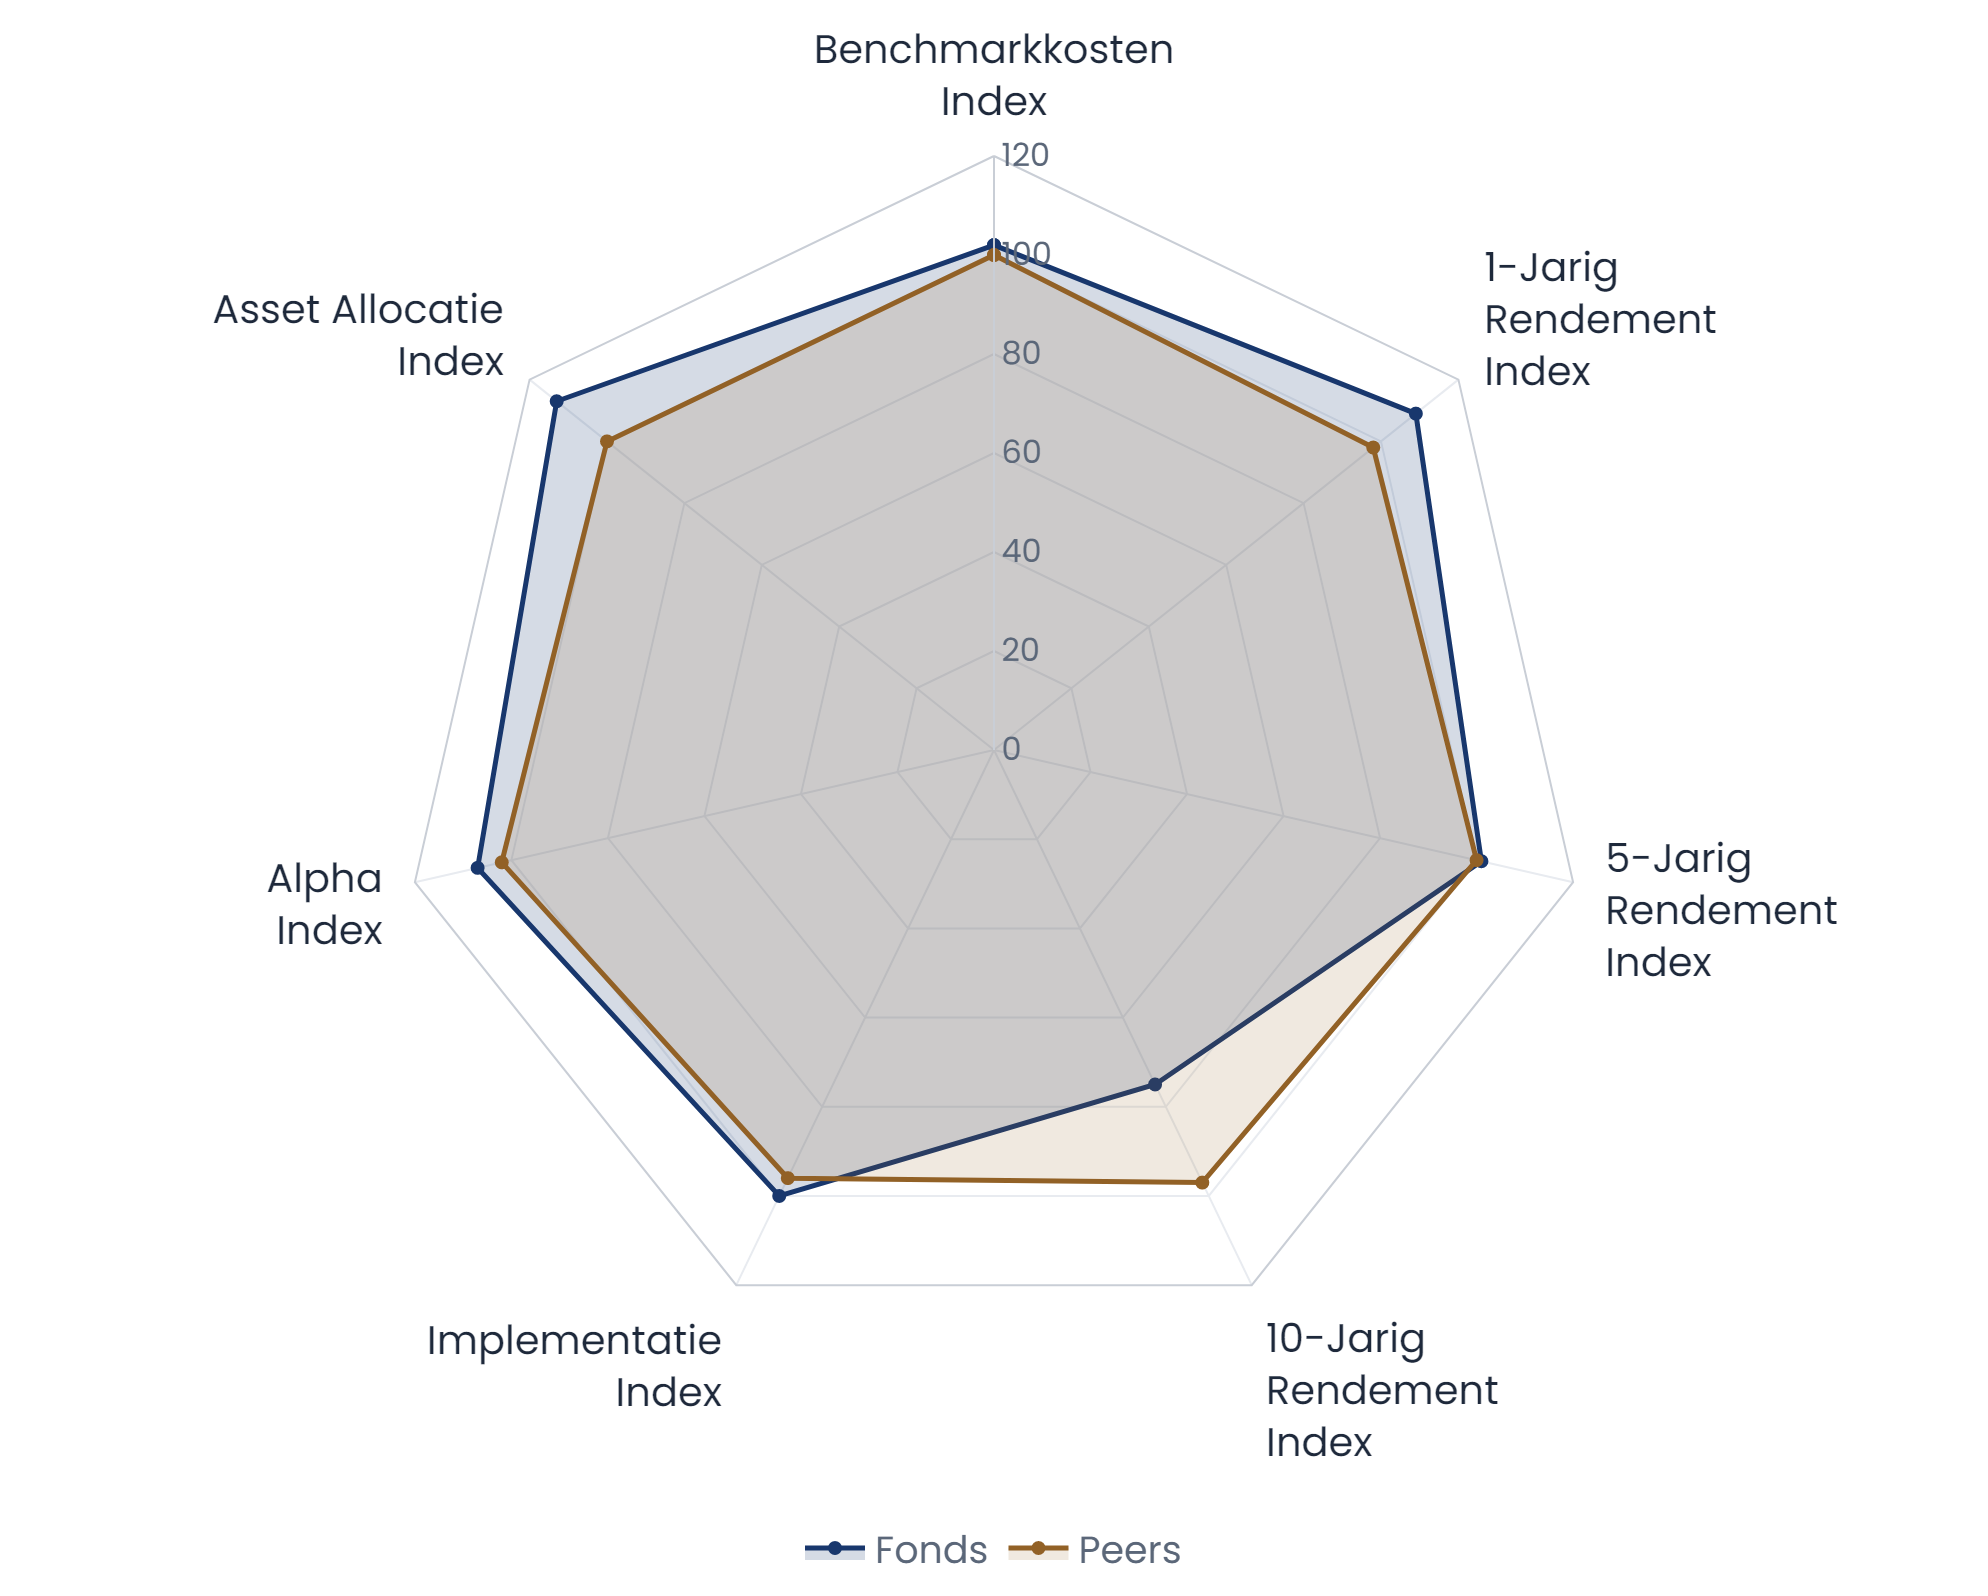
“A thorough benchmark goes further than comparing costs alone and also brings into view the factors that explain the differences.”
Under the Wtp, costs and returns become more visible to members. At the same time, differences in investment policy and risk profile can create differences in returns and asset management costs within a single pension fund.
The IBI Transition Mirror makes visible, at total fund level, what changes around the transition and whether earlier expectations are met.
But benchmarking does not stop after the transition. Annual benchmarking supports the board in monitoring costs, performance and policy choices, and provides an independent frame of reference for assessment and accountability.
From expectation to reality — and then continuing to measure, explain and account for it year after year.
A baseline measurement before the transition and a follow-up measurement afterwards: have expectations been met, and how can the differences be explained?
From the board and the investment committee to the supervisory board and the accountability body.
The key overviews and analyses in a single document for the board.
Key figures, asset management, solvency and pension administration — compared with peer group and universe.
A digital report free of jargon, for members, the supervisory board and the accountability body.

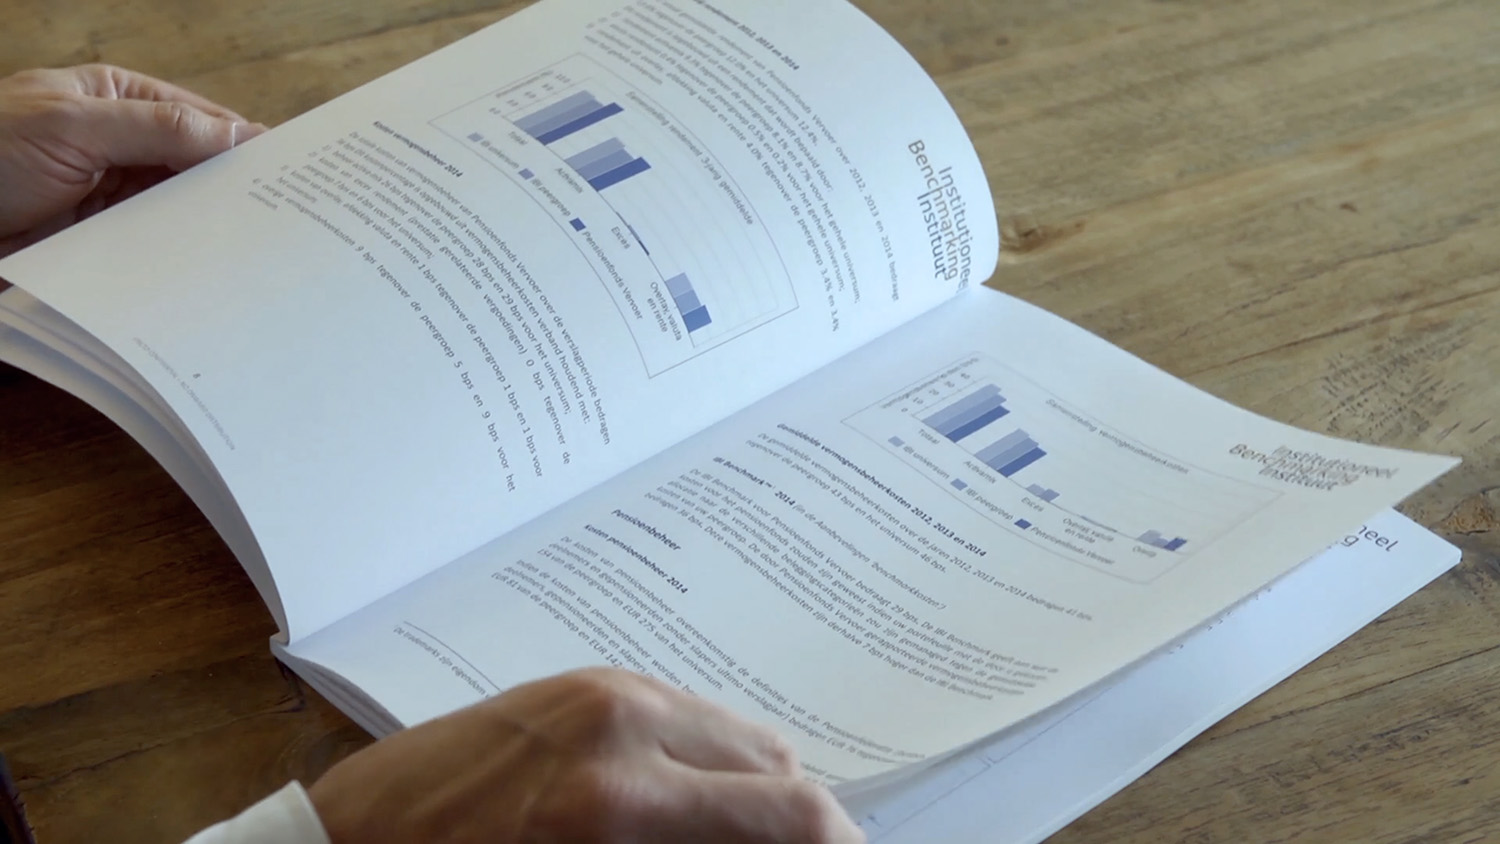
Since its foundation, IBI has benchmarked 79 different Dutch pension funds. IBI also publishes and presents on cost transparency and accountability — in the Netherlands and beyond.
Eric Veldpaus talks to the BBC about benchmarking, implementation costs and transparency.
Curious what thorough benchmarking would mean for your fund? Get in touch for an explanation of the reports or an informal introductory meeting.